Geographies of Emissions: EDGAR
- gavin774
- Jun 24, 2020
- 4 min read


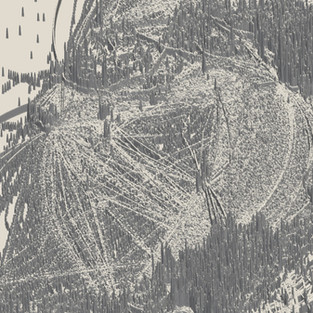


EDGAR v5.0 Emissions map, All sectors CO2 ( excl. short-cycle organic C) 1970
Central in the global effort to reduce Greenhouse Gas (GHG) emissions is our ability to identify their sources. An essential component of the UN Framework Convention on Climate Change (UNFCCC) is the collation of national emission inventories broken down by industry sector and GHG species. In 1992 when the UNFCCC was first drafted the world’s wealthier countries were considered liable for “the largest share of historical and current global emissions of GHG”. These countries were designated as Annex I, and required to submit detailed annual reports of emission sources and sinks. Non-Annex I countries submit National Communications every 3-5 years and Biennial Update Reports (BUR), although owing to the complexity and cost of creating inventories some of this data is more than a decade old. Inequalities in infrastructure and technological resources significantly impact
on national efforts to monitor emissions.
Due to the difference in reporting requirements the UNFCCC has limitations when analysing the global carbon budget, an issue that has become more tangible as the share of non-Annex I emissions increases. As a more accurate and timely source of data the scientific community have developed a number of global emissions projects, such as the Global Carbon Project (GCP), the Carbon Dioxide Information Analysis Centre (CDIAC) and the Emissions Database for Global Atmospheric Research (EDGAR, 2018).


EDGAR v5.0 Emissions map, All sectors CO2 ( excl. short-cycle organic C) 2018
The EDGAR project outputs two complementary datasets running from 1970 to near present, a breakdown of country level GHGs statistics, and high resolution global maps of emission sources. The datasets are collated from a wide range of sector specific organisations, including energy emissions derived from the IEA energy balance data, industrial process from UN STATS, and agricultural crop and livestock statistics from FAOSTAT. A full list of the sector groupings can be seen on the EDGAR site, and the methodology is detailed by Janssens-Maenhout et al (2017).
In order to generate the maps this complex and heterogeneous data is further combined with a set of geographic datasets that act as spatial proxies for the GHG sources. Example include livestock geo-data from Earth Observation & Citizen Science, road transport derived from OpenStreetMap, and aviation routes form the Airline Route Mapper. Crippa et al (2018) outline more than 30 spatial datasets that have been joined in various ways with the emission stats.


EDGAR v5.0 Emissions map, CO2 ( excl. short-cycle organic C), Shipping 1990, Road Transporation 2018, Aviation 2018
The work shown here employs EDGAR’s geographic data to generate 3-dimensional maps of global emission infrastructures: transport networks, gas and oil pipelines, the distribution of power plants and industrial processes. The maps operate over multiple spatial and temporal scales, interweaving the many phenomena of anthropogenic carbon-based processes. Taking just one set of pathways as an example, the layers of data trace the carbon flows through fossil fuel extraction, energy production, the manufacture of materials, and their transportation. At the global scale the evolution of these processes highlights radical changes in the global economy since the 1970s. In broad terms this is seen in the large scale shift in industrial emissions from US and Europe to China and SE Asia, made tangible in the maps as transformations of the carbon geography of these countries. A trend that is predicated on the traction of free trade agreements at the expense of climate change conventions (Klein, 2014, p.75). At the local scale the detailed network of flight paths and container shipping charts our individual impacts on this global process.
In technical terms, the work is being developed using a combination of software tools, including Python and Javascript NetCDF and geographic libraries, and the data visualisation platform Paraview. One of the challenges is converting the fine details of the EDGAR grid, which is on a resolution of 0.1 degrees, to structures that are visible at global scale. Point sources such as power stations, and the fine network of transport links must be mapped to proportionate geometrical features. A further issue is that the EDGAR gridding process converting vector routes to the map pixels causes discontinuities and artefacts in the geometries. These data processing artefacts inflect the formations of the work. In the process of mapping the grid of emission to geometric constructs, forms akin to crustal geologies emerge: scars, ridges, and archipelagos of carbon.


EDGAR v5.0 Emissions map, All sectors CO2 (excl. short-cycle organic C), SE Asia, 1970
References Crippa, M., Oreggioni, G., Guizzardi, D., Muntean, M., Schaaf, E., Lo Vullo, E., Solazzo, E., Monforti-Ferrario, F., Olivier, J.G.J., Vignati, E., Fossil CO2 and GHG emissions of all world countries - 2019 Report, EUR 29849 EN, Publications Office of the European Union, Luxembourg, 2019, ISBN 978-92-76-11100-9, doi:10.2760/687800, JRC117610
Crippa et al (2018), Gridded emissions of air pollutants for the period 1970–2012
within EDGAR v4.3.2, Supplement of Earth Syst. Sci. Data, 10, 1987–2013, 2018
https://doi.org/10.5194/essd-10-1987-2018-supplement
EDGAR (2018), EDGARv5.0 website: https://edgar.jrc.ec.europa.eu/overview.php?v=50_GHG DOI: https://data.europa.eu/doi/10.2904/JRC_DATASET_EDGAR.
Janssens-Maenhout et al (2017), EDGAR v4.3.2 Global Atlas of the three major Greenhouse
Gas Emissions for the period 1970-2012. Earth Syst. Sci. Data Discuss., https://doi.org/10.5194/essd-2017-79
Klein, Naomi, 1970- author. (2014). This changes everything : capitalism vs. the climate. New York :Simon & Schuster


Comments